This is an old revision of the document!
Dashboard
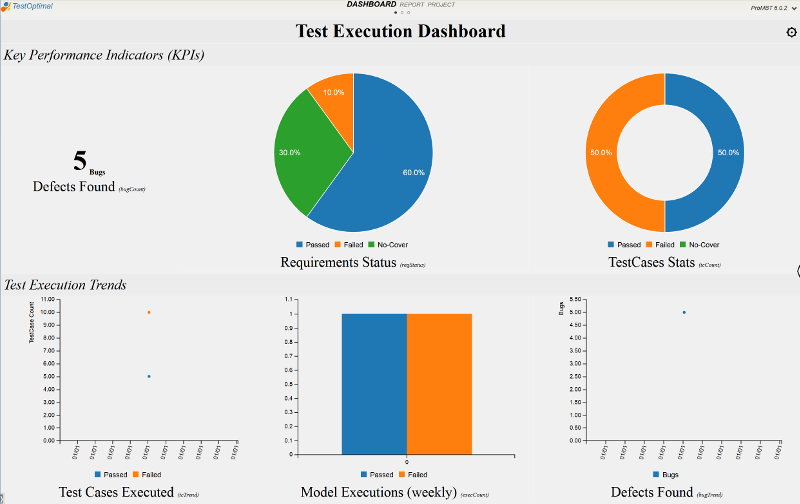
Dashboard helps you track and monitor key performance indicators in your software testing process. It is customizable to fit your needs.
The graphs are organized in groups and graph group contains individual graph from the stats/matrix and KPI. Simple customization can be accomplished with Configure Dashboard. For expert users, you can edit the config/DashboardConfig.json.
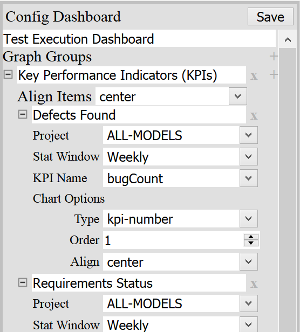
Configure Dashboard
- Project - models are grouped into projects, see Project
- Stats Window - KPI collection interval: daily, weekly, bi-weekly, monthly.
- KPI Name - KPI and metrx / stats to be displayed


