This is an old revision of the document!
TestOptimal IDE Overview
TestOptimal IDEs share the same layout and design. Most of the functions can be accessed with just a few clicks away.
This page describes the basic IDE screen layout, navigation and customization.
TestOptimal IDEs
These are TestOptimal IDEs and applications available for various TestOptimal Editions:
- State Model IDE - PromMBT, Runtime
- Data Design IDE - PromMBT, Runtime
- Server Manager - SvrMgr
- Dashboard - ProMBT, Runtime, SvrMgr
The IDEs and Server Manager are launched with http://localhost:8888 while Dashboard application is launched by clicking ![]() on the application header.
on the application header.
Buttons and field labels usually have hover message that gives the contextual information. Additionally many application screens have ![]() that opens up more information about the screen.
that opens up more information about the screen.
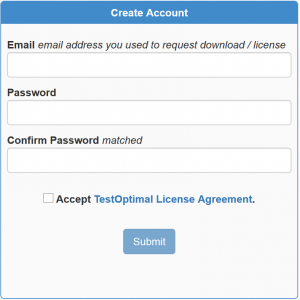
The first time you open IDE, you will need to set up a local account to access the server:
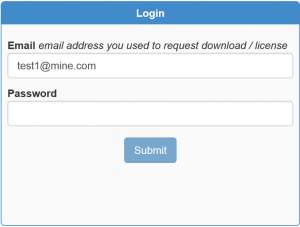
Subsequently you will just need to login:
The “Login” button is enabled when all fields are entered and passwords matches (first time).
You may change password by editing following entry in config/config.properties:
security.password.MyAcnt=enc(qEan3eThHg0\=)
Enter your password in clear text and restart TestOptimal server, the password will be encoded automatically.
Screen Layout
TestOptimal IDE consists of an Application Header on the top, a Content-Area in the middle and a System Message Pane at the bottom.
Hover over button, links and field labels to show contextual information.

Application Header
The application header has menu, toolbar and a set of tab selection. The far right is the application info menus.
Menus
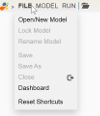
Menus are accessed by hovering mouse over .
Hover over menu name to show drop-down menu items. Some menu items may require a model to be open or a specific tab is open.
Toolbar
Tabs
Tabs are listed in the center of the application header when a model is open. Click on the bar graph icon to open Dashboard.
Info Menus
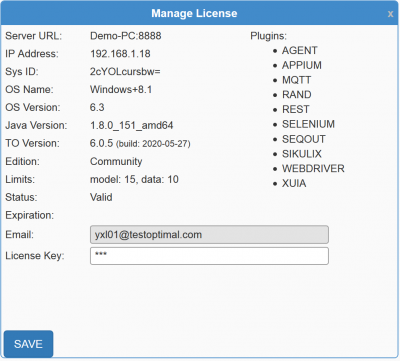
On the right of application header is Info Menu. Click on the edition to open Manage License and mouse over down-arrow to show drop-down menu items.
System Message Pane
Informational, alert and error messages are displayed in this area.
Upon new message is received, the message will be displayed and hide after 5 seconds.
A solid bar on the left indicates there are messages. An orange bar indicates there are error messages. Clicking on this solid bar will open the message pane.


