Server Stats
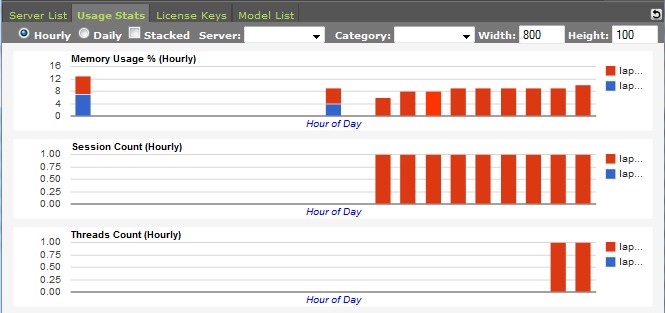
Server Stats, a tab page in Server Manager, shows the historical stats for the Runtime servers.
Note: Internet connection is required for this tab to function. It uses Google's chart service to create the charts.
Stats Display
The following stats are displayed:
- JVM heap usage
- Model execution session count
- Virtual user (thread) count
Stat Collection
The stats are collected and displayed server status and its usage stats over the past 30 days.
The stats by default are shown in hourly interval for today's stats and daily interval for the past stats. You can choose between hourly (today's) stats or daily stats by clicking on the radiobutton.
The stats are shown in bar chart with each servers in different color. Refer to the legends to the right of the chart for the color scheme. By default, the charts are displayed in stack mode which means stats for all servers are stacked up at each time position. You can display the chart in non-stack mode just by unchecking the check box.
The horizontal axis is by hour for the hourly chart and by day for the daily chart.
You can filter the list to only display the stats for specific server(s). Use the Server and/or Category Code drop-down lists to select the server with the specific name or contains specific Category Code.
Category Codes are codes assigned to a Runtime server when you configure (add) the server to Server Manager (See Server List Tab). The category codes are used by Enterprise Edition to search for a Runtime server to execute the model.
You can also change the size of the chart by setting the values in Width and Height fields in pixel. The values must be positive integers.

